Think of the nutrients in orchard soil as a ‘bank balance.” Tree roots access the ‘money’ in the soil, using water and oxygen as their passbook.
In a presentation at the 2017 Pistachio Short Course, University of California (UC) Davis plant scientist Patrick Brown explained the basics of plant nutrition including how nutrients are acquired by plants and the when and where of tree nutrition—basic principles necessary to crop production.
Nutrition 101
Nutrients are taken up in water only by active roots on trees with leaves. While the size of the nutrient pool is the bank balance, withdrawals from the bank are limited by the solubility of the nutrients in the pool. Soil pH, minerals, lime, cation exchange capacity (CEC) and organic matter determine solubility and soils must allow for root penetration plus provide adequate water and oxygen for root growth.
The pH range of 6.5 to 8.0 is optimum for most macro nutrients in fertilization plans. Nitrogen, sulphur, magnesium, calcium and boron are mobile nutrients and soluble in most soils, but they can also be leached or displaced.
Nutrients that have restricted solubility and movement in soils must be in the same place as tree roots to be taken up. Those with limited solubility include manganese, zinc, copper, nickel, iron and phosphorus. Soils that limit root growth can cause deficiencies in zinc, iron and copper. Brown noted that potassium is mobile and available to roots in some soils, but not in others. Soil tests to determine potassium-fixation are essential to management of this nutrient.
Other factors that can affect nutrient uptake include poor root growth, salinity of soil or water, nutrient imbalance, or low or high native soil fertility for one or more nutrients. Weeds, drought or soil saturation can also impact nutrient uptake.
Brown said the mobility of an element determines how fertilizers should be managed, where and when symptoms of deficiency and toxicity will appear. Boron is the only element that varies in mobility between species. It is highly mobile in almond, but immobile in pistachio and walnut.
The mobile elements nitrogen, phosphorus, potassium move in both the xylem, from roots to leaves and phloem. Photosynthesis and growth drive uptake and movement. Elements that move poorly through the soil; calcium, zinc, manganese, iron and boron move almost exclusively in the xylem—in a one-way flow with water. These cannot be stored for later use and have limited long term effectiveness.
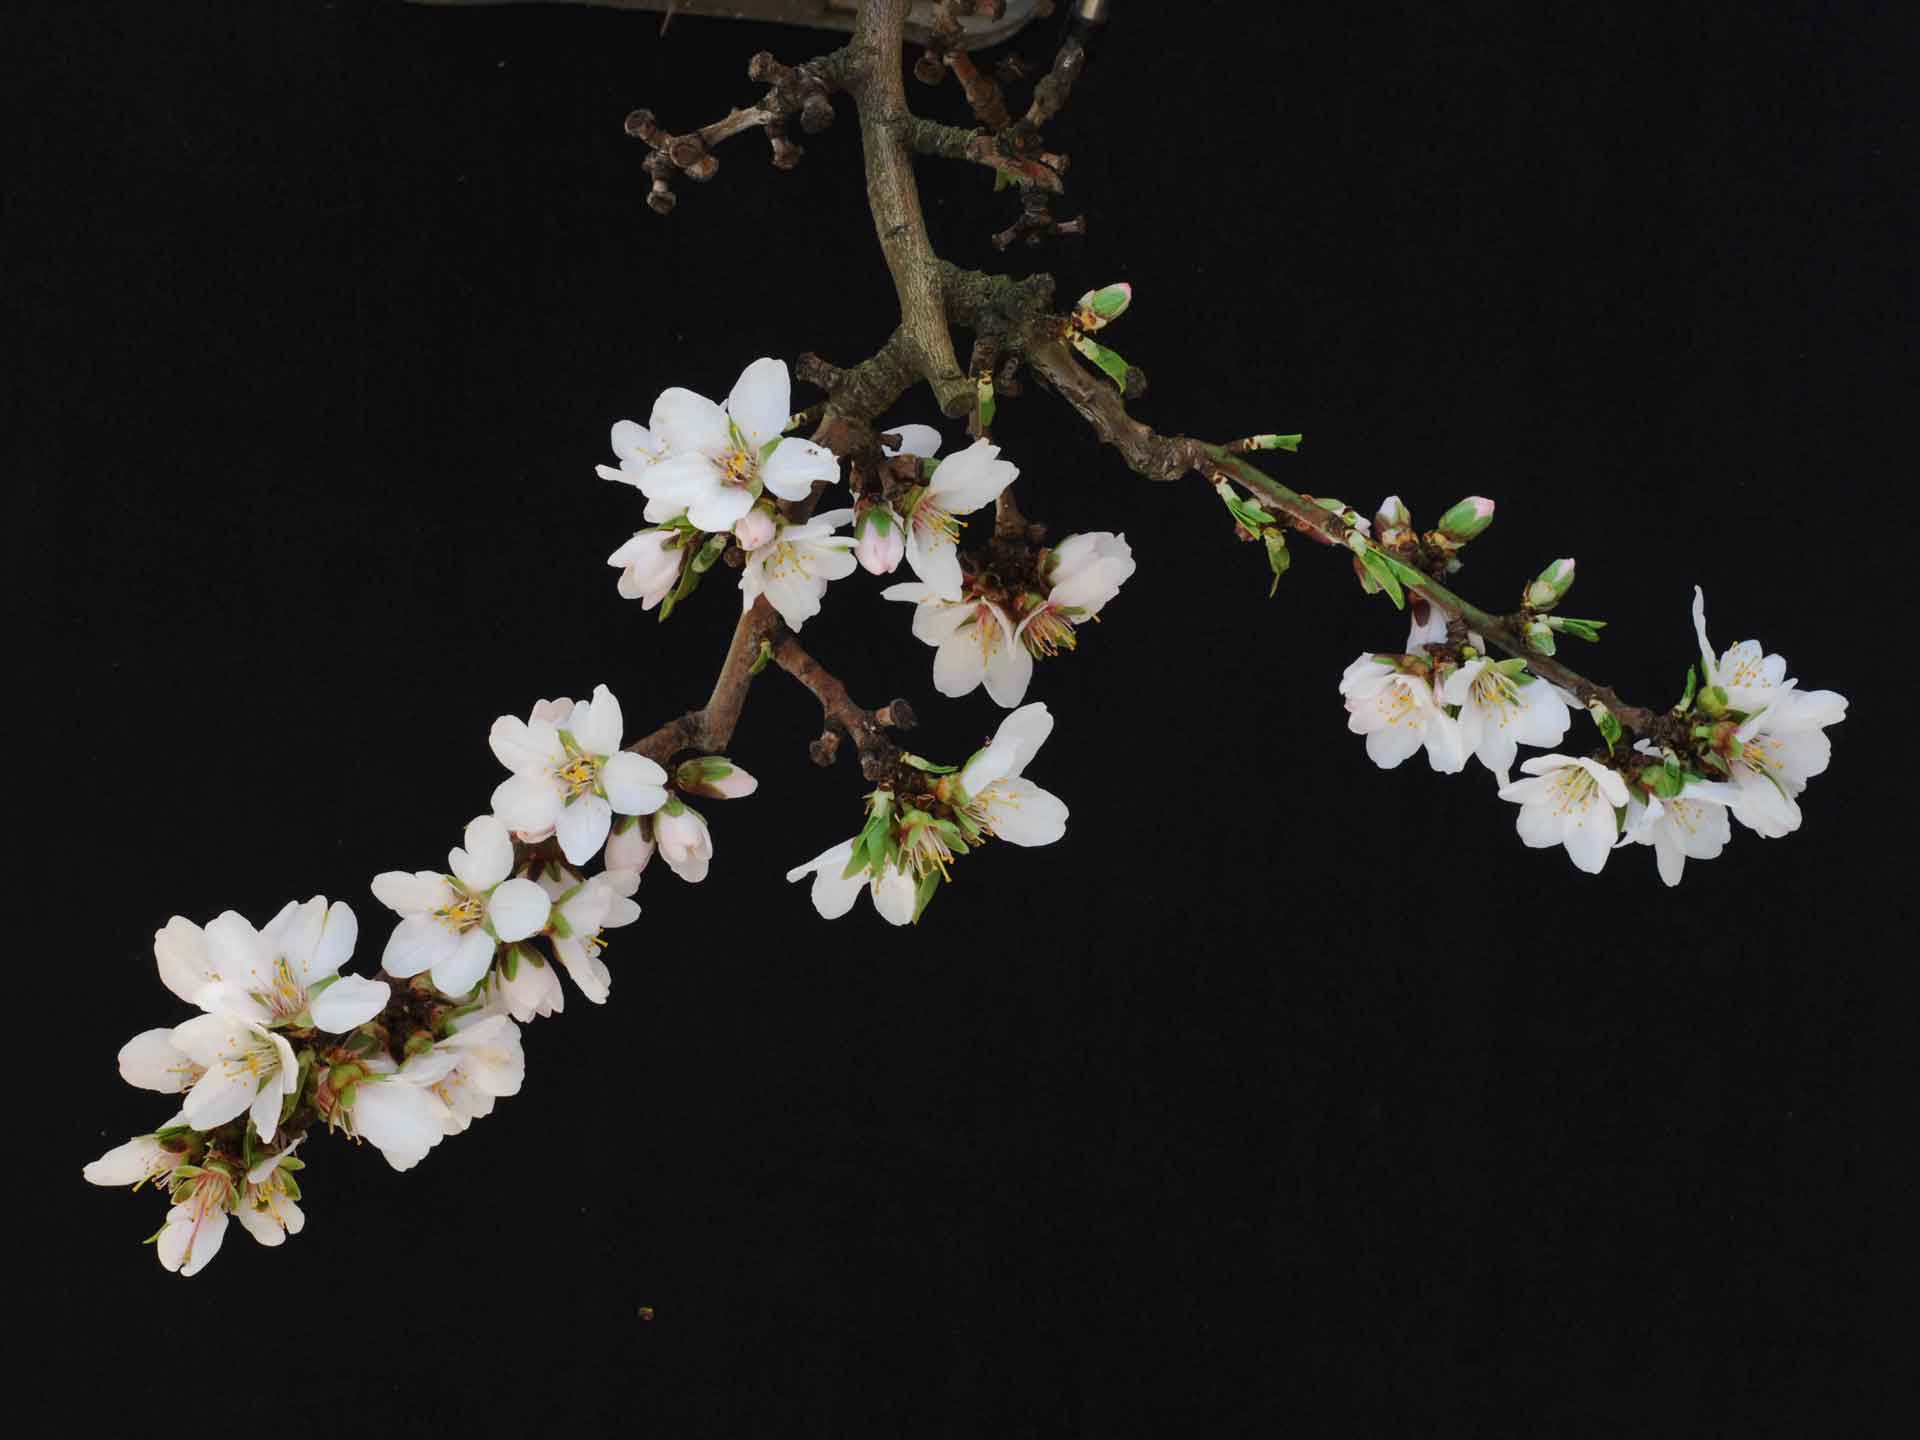
Immobile nutrients can cause deficiencies in specific plant parts, Brown said. For example, flowers on a plant can be deficient in boron, while leaves can have sufficient supply.
Focus on Nitrogen, Potassium
Leaf, water and soil samples are all good tools for determining fertilizer rates. Understanding plant nutritional needs also helps growers.
How to sample, knowing the critical values for each nutrient and recognizing plant symptoms are also important steps in a successful nutrition plan. Nutrients are used most efficiently, Brown said, when they are applied at the right rate, the right time, the right place and come from the right source.
There are some limiting factors in leaf sampling and critical value analysis. Numbers are not strong in small-scale yield trials, and leaf sampling provides no guideline on how to fertilize. Numbers can indicate a deficiency, but there is no clear direction on how to respond. Leaf sampling is a monitoring tool, Brown emphasized, but it is not an adequate management tool.
One of the challenges with leaf sampling is the variability of the tree canopy. Levels of N and K can be different from top to bottom and on fruiting and non-fruiting branches. Samples collected in July are too late in the season to influence management.
Samples should be collected soon after full leaf expansion—30 to 50 days after bloom. Sub terminal leaves on non-fruiting branches should be collected from a minimum of 13 trees at least 25-30 yards apart. From each tree, 10 leaves should be taken around the canopy from well exposed branches between 5-7 feet from the ground. In non-uniform orchards, each soil zone should be sampled separately.
Spring samples can predict summer tissue values according to UC Davis. The model for interpreting spring analysis can be found at http://fruitsandnuts.ucdavis.edu/weather_Services/Nitrogen_Prediction_Models_for_Almond_and_Pistachio/.
Mandated nitrogen management
Achieving optimal productivity with restricted nitrogen use will require enhanced efficiency, Brown said. Application rates will be based on specific crop N budget estimations and account for all applied nitrogen. He noted that regulations are still being developed, but there will be training and testing required to sign off on nitrogen plans.
The nitrogen cycle in an orchard is a balancing act, Brown said. Supply can come from several sources including water, residual in the soil, manures, cover crops and compost along with commercial fertilizer applications. Nitrogen can be lost below the root zone and volatilize from the soil. Demand for this nutrient comes from the harvested nuts, also the husks, leaves, prunings removed from the orchard.
Average nutrient removal per 1000 pounds of crop is 28 pounds for nitrogen, 25 pounds for potassium and 3 pounds for phosphorus. Annual tree growth requires 25 pounds of nitrogen (averaged over 20 years).
Choosing the right rate of application, Brown said, requires setting a realistic yield goal. Orchard history and environmental condition will play a part as will visual evaluation of trees in April and after fruit set. Growers’ fertigation scheduling should take into account the high mobility of nitrogen and possibility of leaching by irrigation water. To avoid leaching and increase efficiency, nitrogen should be added toward the end of the irrigation cycle and applied in as many small doses in a year as possible.
After conducting a preseason yield prediction, demand is calculated minus the nitrogen levels in soil and irrigation water. Applications of nitrogen should meet the difference. Timing of applications should meet demand of that stage of production. The first application, when leaves emerge supplies 12.5 percent of the annual N demand. The next two applications supply 25 percent each of the annual demand. Final application of 37.5 percent is in July, the time of the greatest crop demand.
Symptoms of nitrogen deficiency include pale new leaves, reduced shoot growth and older leaves that yellow and drop. At that point, Brown said, yield is affected.
Leaf symptoms of potassium deficiency will appear early to mid summer. They include small leaves with scorched margins and sparse foliage with pronounced dieback. Yields will decline as potassium levels decline.
Phosphorus deficiency, not common in California, shows as interveinal chlorosis, the bright yellow, desiccated leaves. Signs are seen first on leaves next to clusters.

Cecilia Parsons
Cecilia Parsons has lived in the Central Valley community of Ducor since 1976, covering agriculture for numerous agricultural publications over the years. She has found and nurtured many wonderful and helpful contacts in the ag community, including the UCCE advisors, allowing for news coverage that focuses on the basics of food production.
She is always on the search for new ag topics that can help growers and processors in the San Joaquin Valley improve their bottom line.
In her free time, Cecilia rides her horse, Holly in ranch versatility shows and raises registered Shetland sheep which she exhibits at county and state fairs during the summer.


