West Hills College hosted an Open Farm on October 25, 2017 on the Farm of the Future to demonstrate some of the latest technology. Technology just for the sake of technology will rarely bring benefit. However production or management needs that can be satisfied through the application of technology should be considered. The Farm of the Future tries to incorporate technology we believe to have practical usefulness to growers. Demonstrations at the Open Farm event included: the use of wireless sensors/control network with software to determine power and water efficiencies; use of infrared imagery to determine plant stress and vigor; and the use of electrical conductivity sensors to determine salinity. It is this last technology that is the subject of this article.
Crops, whether they be annual row crops or permanent orchards, respond to various factors. These can be categorized as: anthropogenic (human impacts such as compaction or irrigation), edaphic (basic soil characteristics such as salinity, texture, organic matter), meteorological (rainfall, humidity, etc), biological (disease, microorganisms), or topographical (slope, elevation).
Identifying all of these factors and understanding the impact each has individually or interrelated to other factors would allow the nut producer to control and prescribe treatments that give the maximum or optimum yield. The trouble is that we do not know all of the interrelationship and rarely have consistent and accurate data on these characteristics. Of special interest to most nut producers is the amount of salinity and depth of salinity in the soil profile.
Salinity is one of those edaphic characteristics that is highly correlated to other soil characteristics. Texture of the soil and the water content are two other characteristics that are highly correlated to the level of salinity. Salinity affects the uptake of water and nutrients by tree roots, limiting the absorption of both.
There are several methods to determine the extent of salinity. The most accurate, though also the most labor intensive and expensive, is to take soil samples and test within a soils lab. A faster and cheaper method that results in a large number of spatially correlated data points are variations of sensors that automatically collect for “electrical conductivity”.
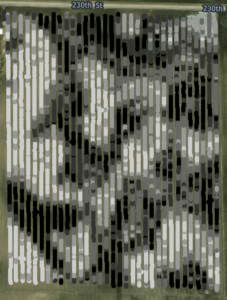

What is EC?
Electrical conductivity (EC), as the name implies, is the ease with which an electrical current is conducted through the soil and is measured in milliSiemens/meter. Commercially available sensors pass an electrical current through the soil and record the resistance or conductivity of the soil in “apparent Electrical Conductivity (ECa).
There are three different paths that an electrical current can take through soil. First, it can follow the water within the soil’s pore space. For this to occur, the soil being tested must be at approximately 50-70 percent of field capacity, otherwise there is not enough water for an accurate test. Second, the current can follow the solid soil particles that are contacting each other. This can provide information on the soil texture. Thirdly, there can be an electrical pathway using both solids and water.
Two different methods are used to collect electrical conductivity: electrical resistivity and electromagnetic.
An example of an electrical resistivity device is produced by Veris Technology. The Veris 3100 has six coulters that pass an electrical current through soil. Two coulters are used as transmitters; two coulters in closer proximity are used as sensors that record shallow ECa values; and two other coulters placed further away are used to record deeper ECa values. Values are collected at regular intervals typically resulting in 1200 data points per acre. The Veris 3100 is large enough that a small tractor is needed to pull it through the field. Since the coulters cut into the ground, it is limited where it can be used (for example prepared seedbeds).
An example of an electromagnetic is produced by Geotronics, the most common model being the EM38. While the 3100 is destructive with the coulters that must pass through the soil, the EM38 is passed over the top of the soil. A transmitter generates two electromagnetic waves that pass through the ground horizontally and vertically. A receiver captures the signal as it passes through the ground to record the ECa as millisiemens/meter. Various carts and carriages have been designed for EM devices. Since it collects just one point at a time, it is a slower process and results in a less dense set of data point. The EM38 is a smaller device that can be carried by hand. This allows it to be used in a variety of situations. There are also researchers that believe that the electromagnetic is a more reliable measure of conductivity.
When using either system, GPS should be used to record the location of each data point. Dataloggers are used to record the two different values and combined with a location from a GPS receiver. These values can be mapped for a visualization of soil variability. Georeferencing of the mS/m is important as it allows the transfer of the data in text format and onto a GIS for mapping.
It is important to remember that this value is not in itself a measure of salinity or other common soil characteristic. But because it is highly correlated to many of these characteristics, it can be used to estimate or predict many of these characteristics of soil. EC is therefore a measure of soil spatial variability. Areas with similar EC values also share soil characteristics such as water, texture, OM (organic matter) and salinity. Any difference in these characteristics show up on an EC map.
Higher water content and salinity allows higher conductivity. Clay particles are smaller and form tighter bonds than other types of soil particles, resulting in higher conductivity. OM decreases the conductivity. Each of these characteristics specifically impacts the conductivity of the soil. The problem is how to separate and define the level of just one of these characteristics since they are all interrelated.
The good news is determining individual characteristics can be done with the proper protocol. Three basic uses of an ECa map include identifying variability; determining a soil sampling routine; and determine level of salinity or other soil characteristic.
Soil Spatial Variability
Precision farming or site specific management is based on understanding the variability that is present within a field and then managing it for economic efficiencies. A goal in managing variability is identifying those areas that are homogenous, i.e. areas that have more in common than the area around it. ECa works well to determine these zones since areas with similar ECa values have similar texture, organic matter, CEC (cation exchange capacity) and water content which means similar production decision will be applicable.
This is the one application that requires very little analysis on the part of the user. The mapped points interpolated within a GIS (geographic information system) creates a map showing variability of the field. Using a GIS reclassification tool will create three to five zones of homogenous areas to serve as management zones.
Determine spatial variability for EC directed soil sampling
Completing a soil sampling using a grid has been common in precision ag. A more common technique is using zones to determine placement of soil samples. An EC map can be used to determine the homogenous areas for targeted sampling. The same management zones previously discussed, can also be used to determine where to take soil samples. Usually a group of samples would be taken from each zone and aggregated for a composite sample. The nutrient values from the samples would be used for fertilizer or other management decisions.
Determine level of a characteristic highly correlated with EC
It is important to note again that the millisiemens/meter is not a direct measure of salinity. Even though the ECa values are directly related to salinity, it is also impacted by numerous other soil characteristics. By controlling some of the characteristics, understanding the relationships between the factors, or analyzing the data, edaphic values such as salinity can be estimated.
Ground-truthing by using an EC directed soil sampling needs to be done to collect actual data. The range of values for ECa can be compared or calibrated to the range of values from the directed soil sampling to create a field scale map of salinity or whatever characteristic.
The lab results will also determine some thresholds that can assist in determining what is causing the variability. The most common threshold is if EC is greater than 2 deciSiemen/meter it is an indication that salinity is high enough that it is the predominant characteristic of the EC. This means that the resulting variability map can be considered a salinity map.
Protocol for use of ECa data
Dennis Corwin and Steve Lesch created a protocol for properly using EC. While the list below is a summary, the complete list can be found at the reference listed at the end of this article.
- Establish and describe the field/site and the survey design.
- Collect ECa data with mobile GPS equipment.
- Design soil sampling based on georeferenced ECa data.
- Collect soil samples.
- Complete lab analysis for soil characteristic.
- Calibration of soil properties to EC values.
- Spatial Statistics to determine soil properties.
- GIS database development.
- Graphic representation of spatial distribution of salinity or other characteristic.
The use of this protocol is explained in detail in the article “Field Scale Apparent Soil Electrical Conductivity” by Dennis L. Corwin and Elia Scudiero found in the journal Methods of Soil Analysis published in Volume 1 in 2016.
An increasing number of nut growers are using Veris or EM-38 to determine the salinity of the soil within their orchard. However it is important to remember that the data needs to considered carefully before using it for management decisions. Better yet follow the recognized protocol to analyze ECa data for better decision making.
Field-Scale Apparent Soil Conductivity, Corwin D. L. and Scudiero E., Methods of Soil Analysis, Volume 1 2016, Soil Science Society of America.
Protocols and Guidelines for Field-Scale Measurement of Soil Salinity Distribution with ECa-Directed Soil Sampling. Corwin D. L. and Lesch S. M., USDA-ARS US Salinity Lab. Journal of Environmental and Engineering Geophysics. March 2013, Volume 18, Issue 1, pp.1-25.


