


A new web-based interactive tool from UCCE and USDA’s California Climate Hub provides a one-stop opportunity to track nut crop development and pest phenology at site-specific locations and prepare for extreme weather events.
Launched in late October, CalAgroClimate incorporates decision-support tools with site-specific weather data to help tree nut growers reduce risk and optimize crop management decisions, according to Tapan Pathak, UCCE climate adaptation specialist at Merced. Pathak, along with Steven Ostoja, director of California Climate Hub, were the principal developers of the site.
CalAgroClimate pooled resources from California Climate Hub and the University of California to fund the launch, Pathak said. Pathak added that the free system is a work-in-progress.
“This is a starting point,” Pathak said. “We will talk to growers to see what additional information they want to see in this tool, and most of our approach will be based on what we hear.”
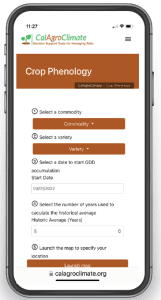
In this first iteration, growers can obtain crop decision support on almonds, pistachios, walnuts and other specialty crops by clicking on one of four categories (crop phenology, pest advisory, frost advisory or heat advisory) and inputting information on crop, variety and other data and clicking on a map to specify location.
Included in the prototype sections are heat and frost tolerance thresholds for different crops, estimates of critical growth stages and pest generation information based on growing degree days. The site also contains links to pertinent UC ANR reports.
“We wanted to provide a one-stop shop,” Pathak said.
Firsthand Knowledge
Pathak said the system is inspired by AgroClimate.org, a climate-based support system for agriculture that was launched in the late aughts by the Southeast Climate Consortium.
“The main founder of that system was my Ph.D. co-advisor at the University of Florida,” Pathak said. “So, I kind of had firsthand knowledge of this system and how it was designed.” Other climate-support systems in agriculture are available in the Pacific Northwest and the Northeastern U.S., Pathak said.
In populating CalAgroClimate, system developers used information from UC ANR publications and other academic sources. Developers determined which categories to prioritize after talking with growers and other stakeholders at meetings, conferences and other events, Pathak said.
“We heard a lot about heat risk,” Pathak said. “And we heard that growers are not that interested in raw weather information, that they want crop-specific information and location-specific information. And we looked for a way in which we can utilize raw data and convert it to some sort of decision support.
“There was a lot of discussion behind the scenes,” Pathak said.
The site uses a high-resolution PRISM statistical mapping system to provide its site-specific weather data, Pathak said, which involves gathering climate information from a range of monitoring networks and implementing sophisticated techniques to develop spatial gridded datasets.
Much of the information on the site is available elsewhere, Pathak said, but finding it can be difficult and time-consuming. Also, other sources of information may not be site-specific.
“You can get a lot of weather information from a phone, but in CalAgroClimate, it is more advisory and more precise to location,” Pathak said.
Also, according to Mark Battany, UCCE water management and biometeorology advisor for San Luis Obispo and Santa Barbara counties, who is a member of the website’s advisory panel, other datasets might not be as inclusive. “Let’s say a grower may be using a weather forecast produced by a meteorologist,” Battany said. “The grower may be comfortable with that, but that forecast may not cover all of the areas of the state they are interested in.
“Let’s say they are an operation that is in different areas of the state,” Battany said. “That would require a number of different forecasts to cover that. To me, one of the big advantages of this site is the spatial coverage that it has. If I want to know what is going on in a broader region, having a tool like this is really useful.”
Another significant benefit is that information is provided in a very visual, easy-to-understand format, Battany said.
“It conveys a lot of information very easily to people,” he said, “and a lot of people respond very well to a clear, visual presentation of information. For me, this product really hits that well.”
Battany added that the gridded weather data available in CalAgroClimate will not replace a need for weather stations and temperature sensors within a crop or a field but will provide a valuable supplement.
“Let’s say, for example, that a grower knows that a portion of his field is prone to frost,” Battany said. “They will still need to have their thermometers and temperature sensors out in that field to make decisions.
“So, these tools are complementary to each other,” he said.
Historical Weather Data
The historical weather data available in CalAgroClimate also is a valuable resource, Pathak said. “If, for example, you want to see how your existing season is compared to last year, or the last 5 or 10 years, then you can compare that type of information and get a rough estimate of how this season will look,” Pathak said. “You can easily get that information in this crop phenology tool.
“You can see how your heat units are accumulating. And if you want to change any type of management based on what you are seeing for the existing year, you can do that type of comparison,” he said. “And with pests, if you want to plan IPM practices with respect to heat accumulations, you can easily get that from this user-friendly tool.”
Almonds, pistachios, walnuts and the other crops featured in this first iteration of CalAgroClimate were chosen because of their prominence in California’s specialty crop industry, Pathak said. Developers plan to include other crops in future iterations.
“California is very challenging for this type of system because we have so many crops,” Pathak said, “and our hope is to meaningfully integrate important specialty crops, but at the same time, we also want to integrate other agronomy.
“This is a starting point, but there is a lot more potential because we have so much diversity in things we grow,” he said. “It is my hope that on a monthly basis, we will have more and more tools as information is validated and ready to be put on the website.”
Battany characterized CalAgroClimate as “an amazing new tool that puts comprehensive past and forecast weather data at any grower’s disposal. California’s high-value crops are subject to a myriad of weather-related risk factors. This tool will allow growers to better address both near-term and long-term risks, and in the end grow more profitably.
“It is very well thought out,” Battany said. “I think it is a very user-friendly tool. It doesn’t take very much effort to learn how to access the data. I think it is very well done.”
Ostoja, the California Climate Hub director, said the USDA division “is a proud collaborator on this important initiative to ensure the state’s agriculture industry can continue to thrive in a future of climate change.”
Other organizations that contributed to the site’s development and launch include UC ANR’s Informatics and Geographic Information Systems (IGIS). Other individuals identified as integral to the development of the site include Lauren Parker, also of California Climate Hub, who contributed to content organization, and Shane Feirer and Robert Johnson, of UC ANR’s IGIS, who provided IT support.
To access the site, go to calagroclimate.org.


