Irrigation is a major investment for nut growers. Getting the best performance out of that irrigation was the topic of a recent “Fundamentals of Irrigation Scheduling” workshop co-hosted by Almond Board of California and UCCE in April and featuring Tom Devol, Senior Manager of Field Outreach and Education for Almond Board of California, and Curt Pierce, UCCE Area Irrigation and Water Resources Advisor.
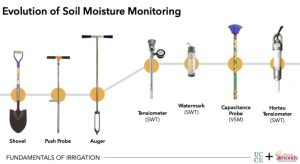
During the presentation in Orland, Calif., Devol talked about Finding Success with Soil Moisture Monitoring, an overview of the tools starting at the boot or shovel to volumetric versus tension-based sensing. Pierce shared information on Scheduling Irrigation with Evapotranspiration, how to create an irrigation schedule leveraging ET data and how to calculate needs for young trees and application rates.
Why Monitor Soil Moisture
Devol, in answering the question as to why monitor soil moisture, said “the list is long,” such as determining when to irrigate, improving crop quality, sustainability and better water management, to name a few.
In addition, answering that question begins with the grower asking questions:
- Is my field moisture good, too wet or too dry?
- Am I leaching water past my root zone?
- Am I getting the most out of my nutrients?
- When do I need to run water again?
- What is my active root zone?
“Answering those questions takes a toolbox,” Devol said. That toolbox can include ET data that helps understand what a tree needs, soil moisture data helping to understand effectiveness of meeting those needs and plant-based data that helps to understand the stress the tree is under.
“They all work together,” he added. “After a few decades of working with these technologies, the place I see the biggest lack of understanding is how much water is going into the ground, how fast is it going into the soil and am I leaching water. None of this has to do with volume; it has to do with status.”
He explained the need for adequate levels of irrigation to avoid overwatering and underwatering and learning how water behaves in sandy loam versus clay loam.
Devol said growers also need to understand where trees’ root systems are pulling water from. The majority (40%) is within the top fourth section of roots going down to only 10% at the bottom section.
“The top half of the root zone pulls in 70% of the water and nutrients,” he added. “Putting too much water on a tree beyond that point can be a waste of water and money.”
He said it is vital to know your soil, what type you have, its infiltration ability and other habits. “This is what you base your irrigation system design on, and if you don’t know your soil, you will run into some big problems down the road,” Devol explained.
Soil, Tree and Field-based Tools
The first level of testing soil moisture is to “kick some dirt,” Devol said, however, among the more technical tools are the basic three: plant based, such as the pressure chamber, volumetric measurement sensors and soil tension sensors.
“They all work together,” he said. “And with all three tools in the box, you get a better answer. They answer different questions, but all work together, and that is really important.”
It is important to understand how to use and read each one of the tools in the toolbox.
Volumetric sensors can give daily water use data, information on when irrigation is required to avoid moving trees into a level of stress and volume of water available for uptake. These sensors also help in tracking infiltration.

Tensiometers on the other hand provide the measure of the force that plant roots must exert to pull water from soil pores, or the force needed to extract water.
Devol also referred to “a new space of tree-based sensing,” which provides direct contact with water tissues for accurate and continuous water status measurement in the tree.
Three Rules of Field Monitoring
Devol offered three rules of field monitoring. The first being that sensors collect a value for a condition; however, they cannot change the condition.
“Sensors can make an observation, but they can’t change that observation,” he said. “They can tell you your soil is wet, it’s dry, but that is all they can do. Just putting a sensor in the ground doesn’t mean you are irrigating better. You have to do something with that information, you have to act on it.”
The second rule: Many times, the condition is not what is wanted or expected.
“I’ve come across farmers who expected a particular outcome on the sensor readings, and when it isn’t what they expected, they call me and say, ‘your sensors aren’t working,’” Devol said. “The sensors were working; the grower didn’t understand the fact that although he had water running on the ground and the sensors were reading low soil moisture, he didn’t have too much water, it was because the water wasn’t infiltrating.”
And the final rule goes hand-in-hand with the second: “If you don’t believe it, verify it.”
“That is what I ask growers to do all the time if they question data,” Devol added. “This is really important. The first year a grower uses a monitoring system, it really opens their eyes. If something seems wrong with the data, recheck it, move the sensor, but don’t give up on using monitoring systems. Trust it.”
ET Reports Still Hold Value
Pierce presented information on using the Sacramento Valley Orchard Source weekly crop ET Reports provided through a partnership of the Northern Region of the California Department of Water Resources and UCCE for agricultural water users.
There is currently published a Northern Sacramento Valley Report and a Southern Sacramento Valley Report. Each publication reports on ET for almonds, walnuts, pistachios and prunes.
Pierce explained crop “water use” estimates are for orchards that are bearing, not limited by soil moisture, and in their fifth-leaf or older.
He said growers can use the weekly report to estimate maximum weekly irrigation run time.
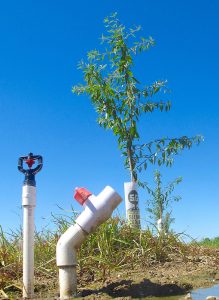
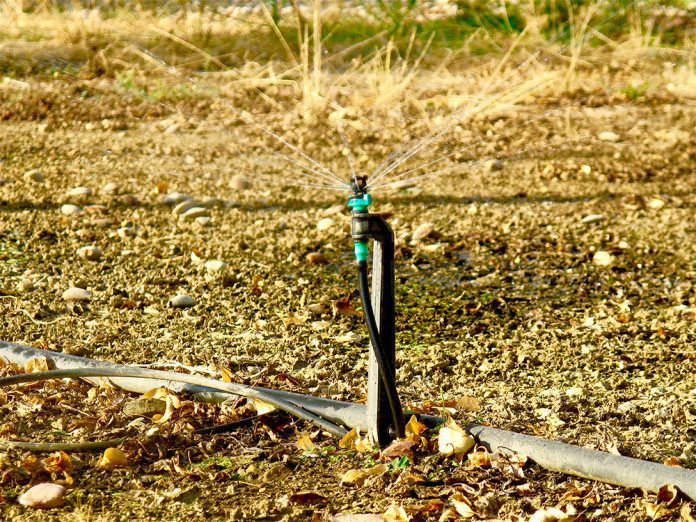
Using an example of water application rate for a solid-set sprinkler irrigation system in almonds (sprinkler nozzles rated in gallons per minute), and using a do-it-yourself calculation of hourly water application rate (inch/hour): 90 trees per acre, solid-set mini-sprinklers, one sprinkler every other tree, offset every other row so 45 sprinklers per acre, with nozzle flow rate 1.2 gpm at 30 psi.
The math: 90 trees divided by 2 (one sprinkler every other tree) x 1.2 gal/sprinkler/min x 60 min/hour = 3,240 gal/hour/acre applied. 3,240 gallons divided by 27,154 gallons = 0.12 in/hour.
Or, Pierce said, a grower can go online to the ET reports, go to ET Calculators (Water Application Rate Calculator for Minisprinkler and Solid-Set Sprinkler) and the work can be done for you.
The information the grower will need to use the online calculator includes flow rate of sprinkler system in gallons per minute and number of sprinklers per acre. The information the online calculator will provide is the applied water-gallons per acre per hour, and applied water-inches per hour.
“You can use the report information to calculate irrigation runtime to replace last week of ETc,” Pierce added.
Using the mathematical process, he showed for example a grower with an almond crop in Orland could figure out from report data the need to irrigate at 0.12 in/hr would equal 7.8 hours of irrigation time.
Pierce noted growers need to consider soil texture and its available water-holding capacity. Very coarse sandy soil water-holding capacity is 0.4 to 0.75 in/ft of soil, while sandy clays, silty clays and clays capacity is 1.60 to 2.50.
The question has been asked, Pierce said, if the weekly ET reports can be used in young, developing orchards.
“The answer is yes,” he said, “ET reports can be useful, but be careful, especially year one during the first month or two after planting.”
Pierce provided a few tips:
- Weekly ET reports are of little or no use during the first month or two after transplanting.
- In-field evaluation of soil moisture and tree conditions is much more useful.
- Once trees are rooted and growing well, ET reports may help, but weekly estimates need to be adjusted for changing canopy size.
- Irrigation amounts may be much less than ET estimates in years one and two depending on soil and rainfall conditions.
Another online help in using the ET report, according to Pierce, includes the Weekly Irrigation Scheduling Tracker per acre and per tree. The tracker asks the grower to enter the orchard-specific information of “weekly crop ET estimate, average hourly water application rate and actual hours of irrigation applied for the week.
In return, the tracker will display the calculation results or answer, which includes maximum weekly hours of irrigation needed, actual inches of water applied for the week and percent of estimated weekly crop ET.
In conclusion, Pierce said, “Using weekly ET reports may lead to deeper thinking about water management.”
He noted as growers learn more about the use of the ET reports, they may want more precision in their knowledge and practices and “start down a path of advanced water management.”
“In most field situations, applying these weekly reports of ETc with your knowledge of an irrigation system will help assess the upper limit of irrigation amount and irrigation runtime each week,” Pierce said.


