


Listen to the audio version of this article. (Generated by A.I.)
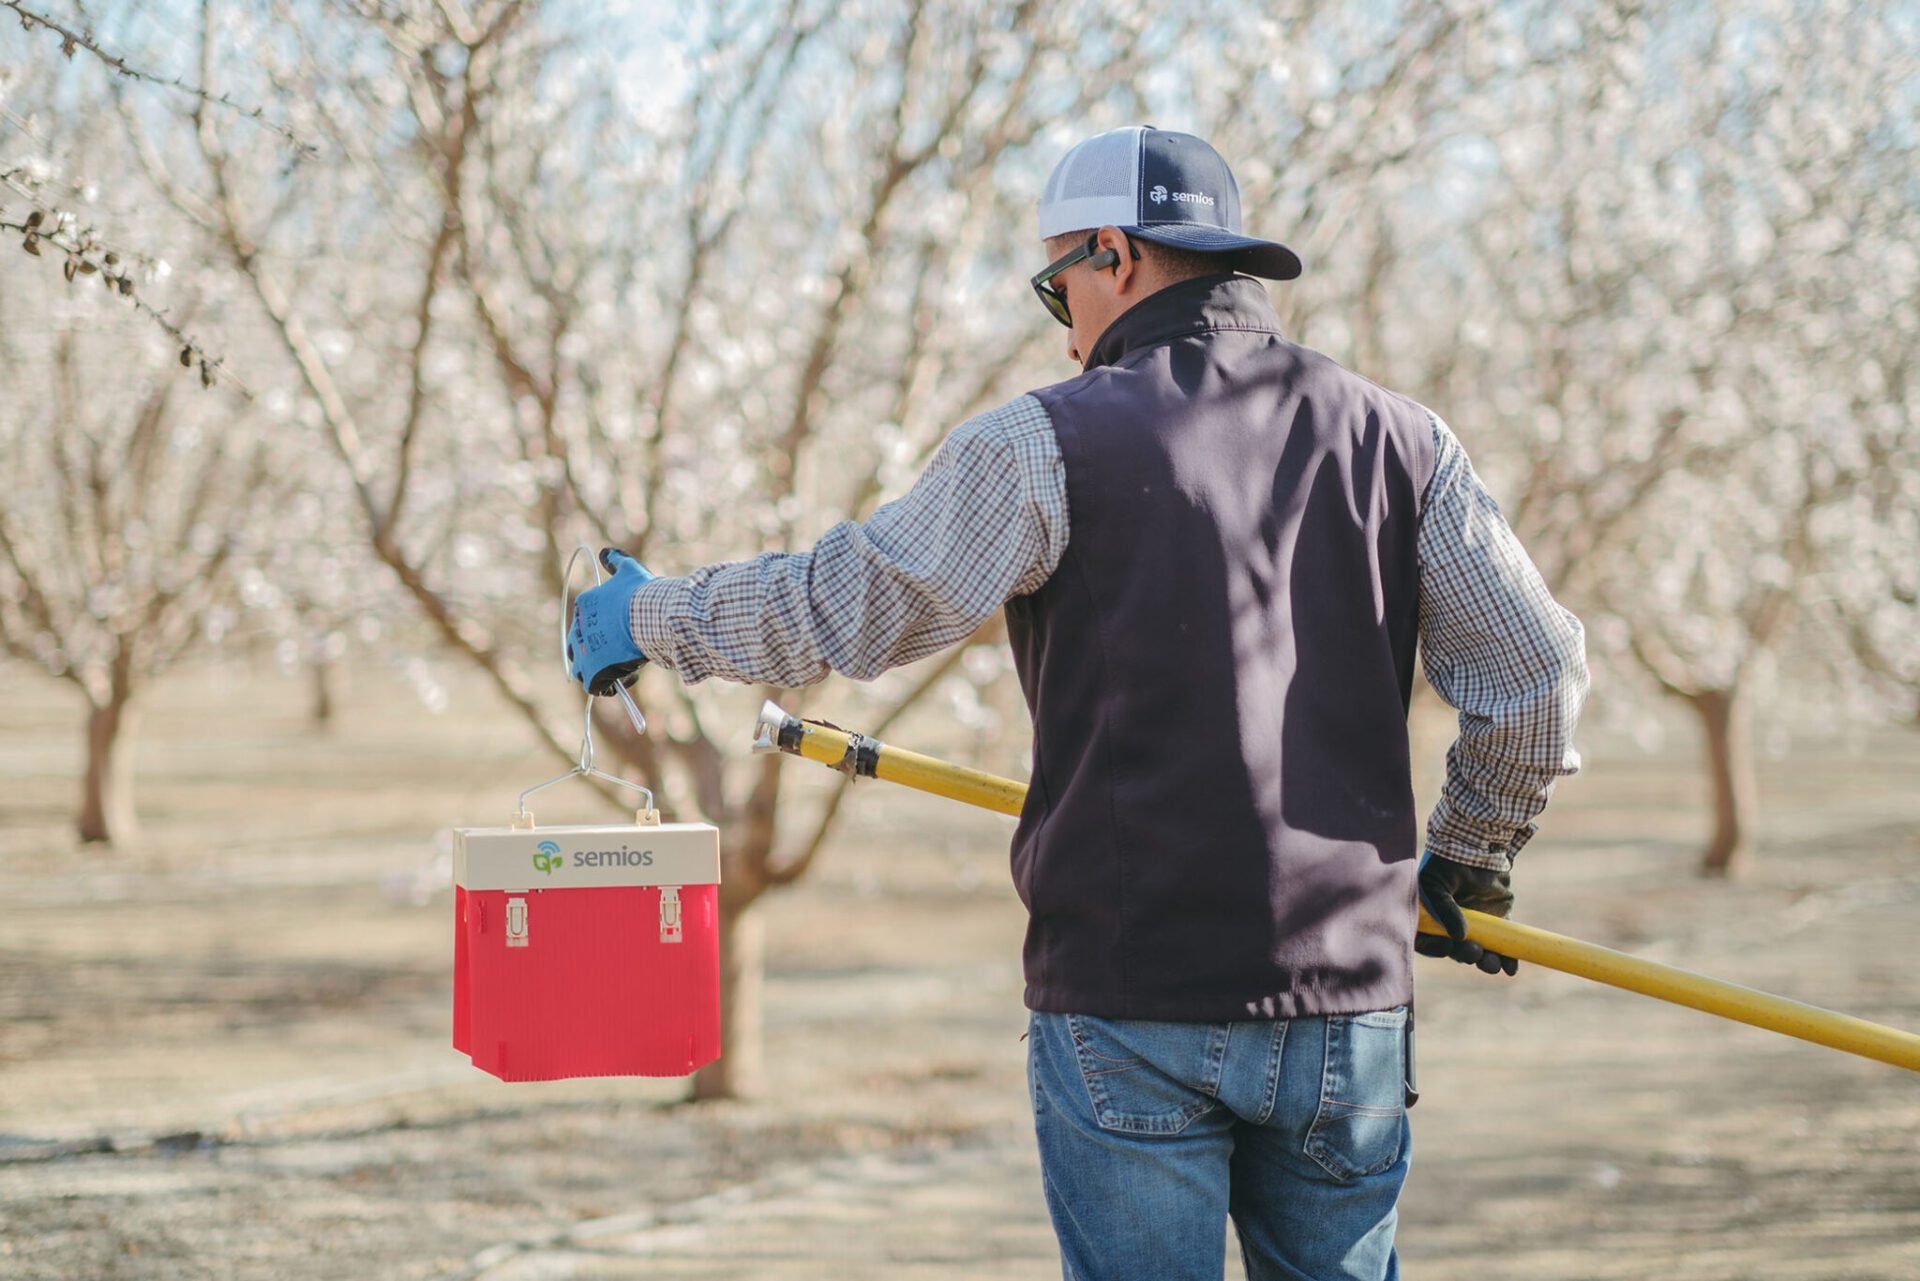
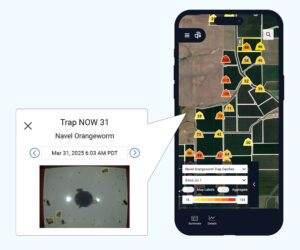
Mating disruption is a widely used tool in nut orchards to reduce navel orangeworm (NOW) populations by releasing pheromones that confuse male moths and interfere with mating. To monitor NOW activity, growers traditionally rely on pheromone-baited traps, which attract male moths and are checked regularly to track flight timing and population trends. Newer flight-sensing technologies take this a step further by placing cameras or sensors inside traps, automatically capturing images and sending moth counts so growers can view trap activity in real time through an app or online dashboard.
Houston Wilson, an associate cooperative extension specialist in the Department of Entomology at UC Riverside, and his colleagues initiated a field study to evaluate flight-sensing smart traps for NOW.
“They’re not entirely new. Many companies have had smart traps out for some time, and I think a lot of growers and PCAs are fairly satisfied with them, but we have not had a chance, until now, to confirm how accurate those counts are, much less how similar of a phenology curve they generate relative to traditional traps,” Wilson said.
Wilson tested five different smart traps using pheromone and PPO (phenyl propionate) lures, as well as another set of traps with an ovipositional bait typically used in the Peterson trap.
Pheromone traps attract male NOW, while ovipositional bait attracts mated females. Using both allows researchers, growers and pest control advisors to monitor both sexes. The PPO is paired with a pheromone, an approach pioneered over the past decade by Chuck Burks, a researcher with the USDA Agricultural Research Service, who is a collaborator on this current smart trap project.
For Wilson’s study, a series of traps was placed in almond, pistachio and walnut orchards. Treatments included all the smart traps and lures, as well as a more traditional wing trap and a delta trap. Traditional and smart traps were placed side by side. For two years, the traps were set out from approximately April 1 to Nov. 1, allowing researchers to compare the flight curves generated by the different smart traps.
“It was a very well replicated study,” Wilson said.
The traps were serviced weekly or biweekly. Data from the digital traps provided NOW count information. Trap liners were then collected, sent to the lab and processed to assess how closely those counts matched.
Early Results
Year two of the research concluded in fall 2025, but Wilson said a large number of trap liners still need to be processed and analyzed. That said, he said findings from the first year looked promising, with all the smart traps showing a fair degree of accuracy.
“We didn’t really have major doubts about the accuracy, per se, and sure there are little errors here and there, but overall, the phenology curves are somewhat similar,” Wilson said.
During the first year, trapping did not begin until late June or early July, which prevented researchers from capturing a full-season flight curve due to the time required to contract and deploy the traps, Wilson said.
Researchers focused on several key questions:
• Accuracy of insect identifications and similarity of the flight curves
• User experience, including how often traps went offline during the season
• Ease of data access through each platform
“Again, the traps seem fairly accurate, but they each have slightly different and sometimes quite unique features,” Wilson said. “At the end of the study, we’re not really trying to determine that there’s one trap to rule them all.”
Instead, the research is evaluating accuracy and functionality so growers can choose the trap that best fits their operation, he said.
Wilson did not use the apps to make real-time management decisions, instead collecting data manually. “We just wanted to get in there and get that count data each week,” he said.
Some of these platforms only provide raw data, while others run the NOW phenology model or generate estimates of what the population might be in a week or month, Wilson said.
Summing up the research, Wilson said, “Really, it’s all about the accuracy of the identifications and the phenology curves.”
Cost and Labor Considerations
The smart traps vary in price, but even the least expensive options are more costly than traditional traps, Wilson said.
“I think all the companies would argue that the cost savings comes in the automation and the data transmission,” he said, “I think a lot of people will find that there is some real utility to using smart traps like this.”
With manual traps, there could be 50 sites, and each trap has to be checked individually, which is time consuming. With smart traps, a grower can wake up, turn on a computer or open up the app to see overnight or weekly counts, identify hot spots and prioritize those locations first.
Smart traps won’t keep growers out of the orchard. They simply provide a more efficient way to check traps, maintain records and access information. The labor savings may help offset the cost of the traps by reducing the need to check them daily. A reduction in labor tends to spark grower interest, particularly given California’s ongoing labor shortages and rising labor costs.
“I think everybody, including ourselves, emphasize, this isn’t something you’re going to put in your orchard, and just farm from your living room,” Wilson said. “You still need to go out there. It just allows you to prioritize better what blocks to go check on first, and hopefully catch any warning signs earlier.”
“These kinds of sensors give you an idea of what’s there right now, today, so it’s clear and present, and you’re starting to create a historical record for each farm,” – Leslie Hickle
Regional Pest Monitoring Network
Using information collected through the research, Wilson and colleagues are now developing a Regional Pest Monitoring Network for NOW using smart traps. Growers have expressed interest in understanding pest activity beyond their own orchards, similar to how weather stations provide regional conditions, Wilson said.
Funding from the California Department of Food and Agriculture, the American Pistachio Growers and the Almond Board of California has supported development of a Decision Aid System, part of the RPMN, that uses smart traps to monitor NOW. Two pilot regions have been selected to develop this program in west Fresno County and Stanislaus County.
“The idea is to set up a grid of these smart traps, and then have that information available online. Growers can go through a portal and see what the pest populations look like throughout the region, and then run the navel orangeworm phenology model, as well as tree nut phenology models to determine crop vulnerability,” Wilson said.
The ability of this pest to infest tree nuts depends on hull integrity. If hull breakdown or hull split has not occurred in almonds, it is very difficult for the insect to penetrate the nut. By examining the nut development stages alongside areas of higher pest populations, researchers can identify how these factors intersect and determine areas of greater or lower risk for NOW infestations, Wilson explained.
He added that by combining data across multiple orchards with smart trap information, researchers may be able to evaluate how sanitation practices, treatment choices and timing influence of NOW pressure and crop damage. Growers still need to service the traps, but automation will hopefully reduce the time and effort required to access timely data.
Smart Trap Technologies
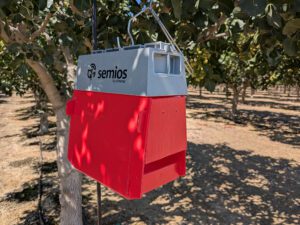
Abigail Welch, manager of grower relations for Semios, said the company uses an automated camera trap. Information from the smart trap can be accessed online or through a mobile app. Alerts can be set up, including the frequency of notification, and notifications can also be delivered by email or text.
The learning curve for accessing information is minimal, Welch said. However, learning how to interpret the data correctly may take more time. Semios has a team of technical specialists who visit orchards, work directly with growers in the field and walk them through the data so they can make informed management decisions.
The smart traps only need to be installed once and after installation, only the lures and liners require replacement. Semios typically recommends changing liners every six weeks or sooner if they become dirty or full. Lure replacement follows manufacturer recommendations and is usually required two to three times per season.
The traps can be left out year-round, but it’s recommended that they be taken down to protect them from harsh weather and tree shaking. The hardware and the software are covered by a five-year warranty.
“To make that warranty last as long as possible, and maybe even go farther than five years, we suggest taking them out in the winter and then placing them back out in the spring,” Welch said, adding that one trap per 10 acres is recommended.
Smart traps offer labor savings by reducing the time required for monitoring. Images are produced daily, allowing growers to quickly identify where attention is needed if something is broken or not functioning properly.
“You can become more efficient,” Welch said.
Smart traps typically need to be serviced only two to three times per season, compared to manual traps that must be checked weekly to determine trap counts. With smart traps, data can be viewed online or through the app.
Semios remote trapping solutions are offered through a variety of plans and pricing options. For more information, contact a Semios representative, Welch said.
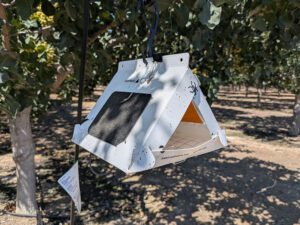
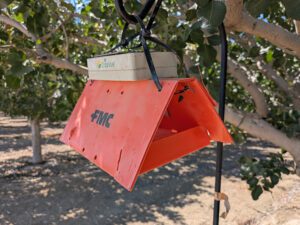
Leslie Hickle, CEO of FarmSense, also offers smart traps. The company’s product differs from others in that it is an electronic device that measures the wing beat frequency of insects’ wings, called WingPrints. The same lure in sticky traps is used, but instead of capturing the insects and imaging them, the device detects wing beat frequency. There are no sticky liners to change in this type of sensor which significantly reduces labor since you only need to visit it to change the lure.
Wing beat patterns are unique and create a characteristic signature that serves as an insect’s fingerprint, allowing for positive identification without trapping the pest. The wing beat signatures are species-specific, Hickle said.
Hickle also recommends removing the device at the end of the season, but she noted that several collaborators installed the sensors on posts between almond trees and have left them in place because they don’t interfere with shaking and harvest operations. Pistachios are different in how they are shaken and harvested, she added.
The benefit of leaving them in is that each FlightSensor contains temperature and humidity sensors. This allows growers to assess in-field conditions for more accurate assessment of environmental conditions affecting both tree health and pest development.
“In almonds, we’re thinking that you can leave them up,” Hickle said adding they are currently testing that theory.
The expected life span of the product is four to five years. FarmSense does not sell the device, instead, the company provides a subscription for the data and information at $299 a year. The subscription includes one sensor, a custom user interface, 24/7 alerts, temperature and humidity sensors and a historical record in their database. Weekly updates are sent out, but growers can request more frequent updates or access the data at any time through a web-based app.
“We look at the FlightSensor as a data collection device, but the real value of what it’s collecting is how we analyze the information and help our customers see what the population is doing,” Hickle said.
He said these kinds of sensors give you an idea of what’s there right now, today, so it’s clear and present, and you can start to create a historical record for each farm.
“And then what it allows you to do is build predictive algorithms based on what’s happening, what historically has happened, and then what may happen,” Hickle said. He added that this information enables more precise timing for NOW treatments as well as the ability to assess treatment efficacy.
The Research Continues
Phase one is complete and focused on evaluating the accuracy of insect identifications and the similarity of phenology curves to those generated by traditional traps. Next, Wilson and colleagues will establish the RPMN and the DAS platform, both of which rely heavily on smart traps. From the two-year study, researchers will select one or more traps best suited for their purposes and scale its use to build these regional networks.
“As we generate these regional data sets, we can start doing different analyses to understand if we need more or less traps per square mile,” Wilson said.
By the end of the project, Wilson hopes to provide growers with clear guidance on trap spacing, how many NOW traps are needed per mile, how to interpolate the data and how to use that information to predict population trends and risk of infestation.
NOW is highly mobile and must be managed at a regional level. “That’s very clear to us scientifically, as well as to growers from their lived experience,” Wilson said.
Currently, there is no established economic threshold for NOW, according to Wilson. Traps are used to determine where populations are higher or lower and to track the timing of flight activity, rather than to trigger treatment decisions based on a specific threshold.
“We really want to try to improve the predictability of risk for growers,” Wilson said. “I think the key right now is, we’re really trying to figure the most optimum way to use them.”


