


The following article summarizes my outlook for the 2020 almond pollination season in terms of estimated demand for colonies, pollination fees, and other information I believe almond growers will find useful. Where possible, information is based on research and data, however some of the outlook comes from my best educated guess given the information available. In 2020, approximately 1.2 million bearing acres of almonds will require roughly 2.4 million colonies for pollination services.
2019 Almond Pollination Market
According to the 2019 California Almond Objective Measurement Report, there were 1.17 million bearing acres of almonds in 2019. This brought in roughly 1.86 million colonies into California. This was down from shipments in 2018, which were 1.93 million.
Abnormally wet and cold weather in the Central Valley made pollination services challenging in 2019. Nut set per tree was down 18 percent from 2018, and total yield in pounds per acre is projected at 1,880, down 10 percent from 2019 (United States Department of Agriculture (USDA) National Agricultural Statistics Service (NASS) and California Department of Food and Agriculture (CDFA), 2019). Not all of this was due to poor pollination, growers also experienced less than ideal weather conditions throughout the rest of the growing season.
Almond Returns and Acreage Trends
As of October 15, 2019, almond prices were between $2.63 to $2.98 per pound depending on the variety. Prices have remained fairly steady in this range since 2016 (Champetier, Lee, and Sumner, 2019). Almond returns per acre have also remained fairly steady since 2016, though these returns seem small when compared with the 2013-2015 time period with almond prices well above $3 per pound.
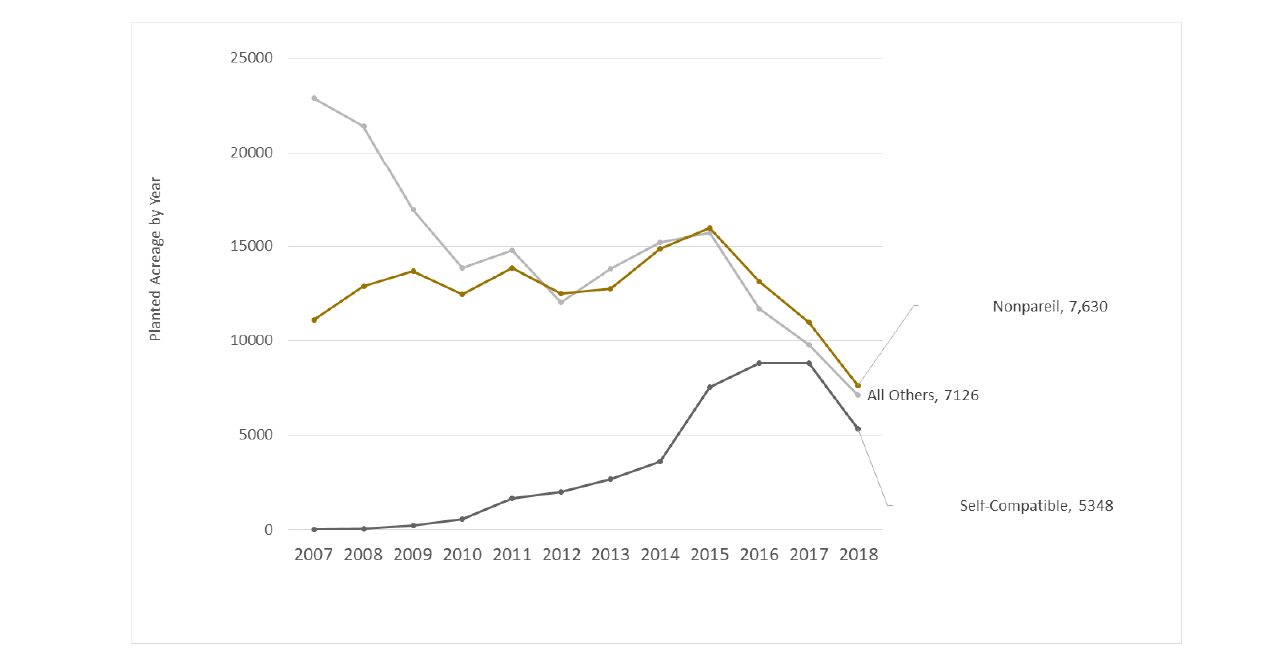
Figure 1 displays trends in planted almond acreage since 2007. Since 2015, Nonpareil and other varieties have seen planted acreage decreasing. This slow in planted acreage corresponds with those decreasing almond prices. Additional concerns about available water going forward has likely contributed to this slowing in planted acreage.
Pollination expenses as a percentage of operating costs have increased from 6.7 percent in 1998 to 20 percent in 2016 (Champetier, Lee, and Sumner, 2019). Consequently, there has been a lot of discussion in recent years about self-compatible almond varieties (Independence and Shasta) as a way to alleviate some of the pollination expenses. Figure 1 shows the significant increase in self-compatible planted acreage from 2013-2016, however planted acreage has leveled off and decreased since 2016. This is likely due to a combination of lower almond returns in general, coupled with the Independence variety not receiving expected premiums in comparison to other varieties (Champetier, Lee, and Sumner, 2019).
Figure 2 shows planted acreage in 2018 by county in California. As expected, counties in the San Joaquin Valley have the highest amount of planted acreage. Figure 3 depicts similar information, but reflects 2018 planted acreage as a percentage of the total bearing acreage in each county. When controlling for the total amount of bearing acreage, percentage increases are distributed fairly evenly throughout the state.
With the exception of Contra Costa and Sacramento counties in Northern California, increases as a percentage of bearing acreage by county range from 0.2 percent to 6.5 percent of total bearing acreage. Contra Costa and Sacramento counties each saw increases over 40 percent, but combine for a total planted acreage of 217 acres in 2018.
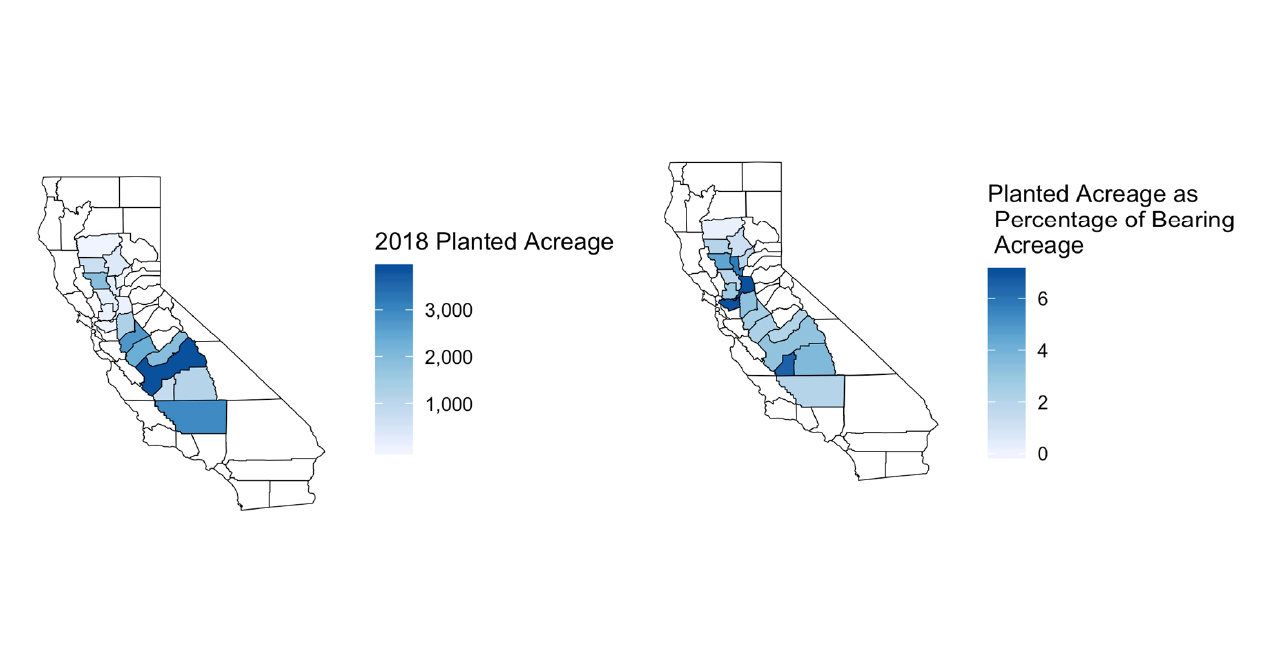
Figure 3(right): 2018 Planted Almond Acreage as a Percentage of Bearing Acreage. Source: 2018 Almond Acreage Report, USDA NASS and CDFA
Colony Demand and Shipments into California
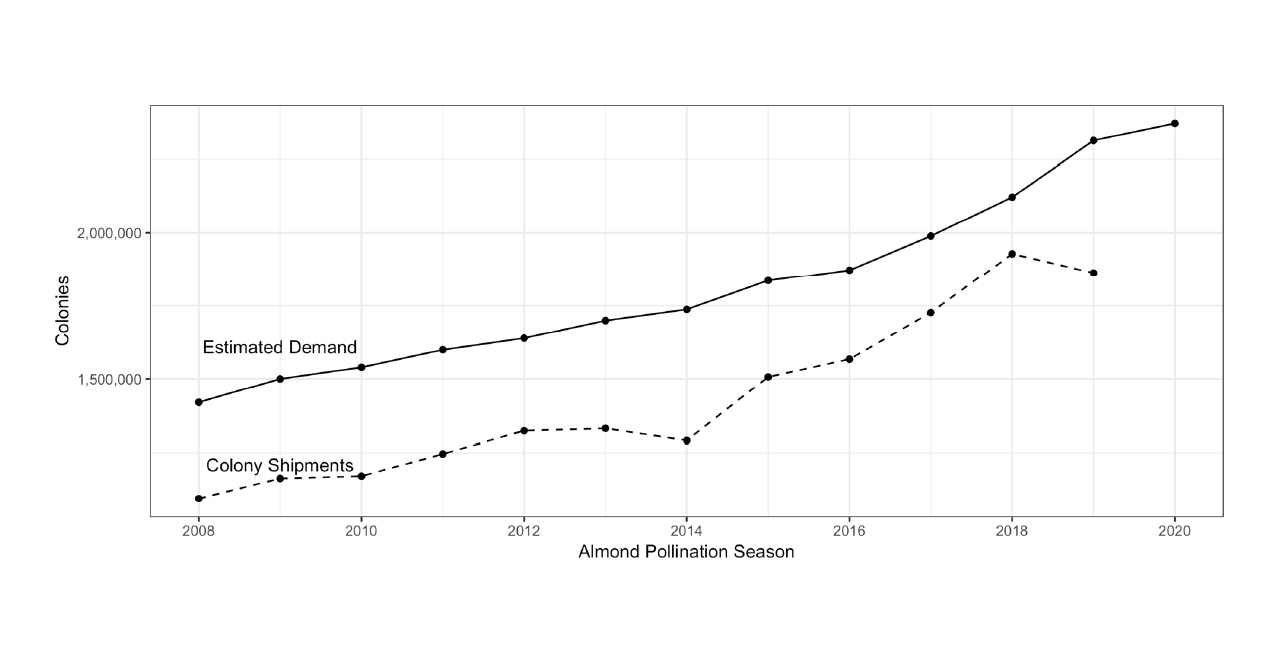
Figure 4 plots the estimated demand for colonies based on bearing almond acreage each year, compared with total colony shipments into California. Estimated demand is calculated using 2 colonies per acre for traditional varieties and 1 colony per acre for self-compatible varieties. There is consistently a gap between estimated demand and colony shipments, which is filled by colonies that remain in California year-round.
Overall, total colony shipments into California went down by approximately 4 percent between 2018 and 2019 almond bloom. The Bee Informed Partnership (BIP) colony loss survey in 2018/2019 found the nation’s highest average winter mortality rate (37.7 percent) recorded since the survey began. This provides some explanation for the decrease in total shipments into California. Total estimated demand for colonies has continued increasing and is up to 2.37 million colonies in 2020, so I do not see this decreasing trend in shipments continuing into 2020.
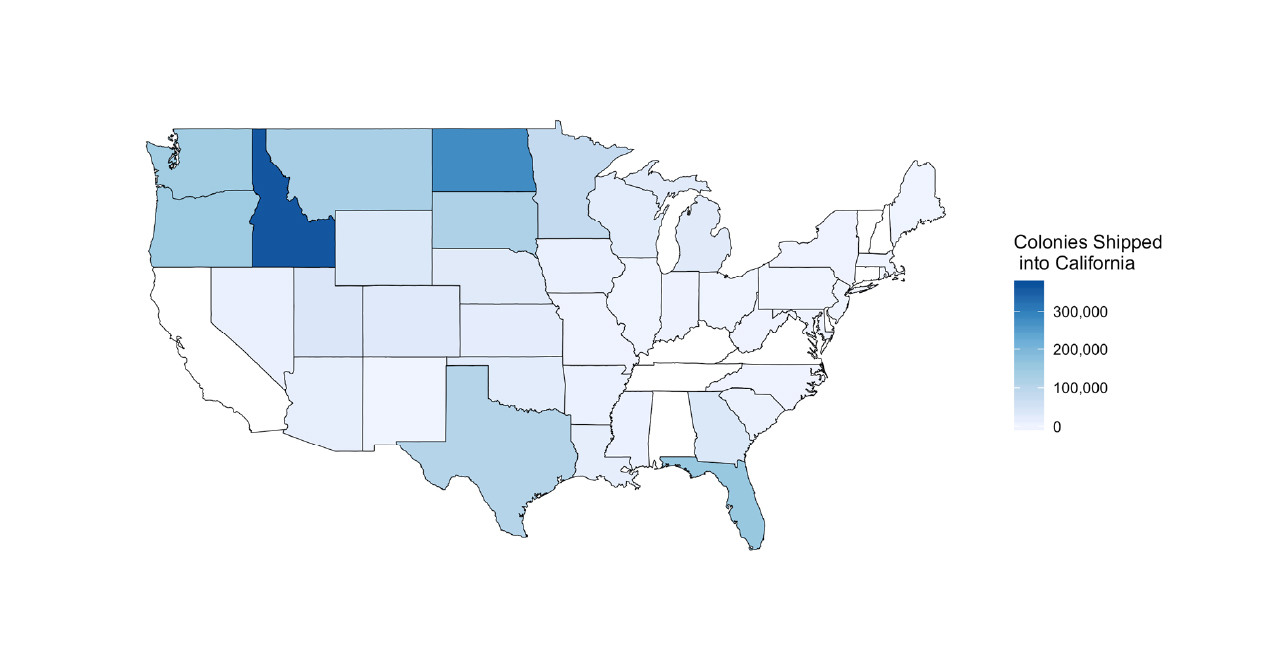
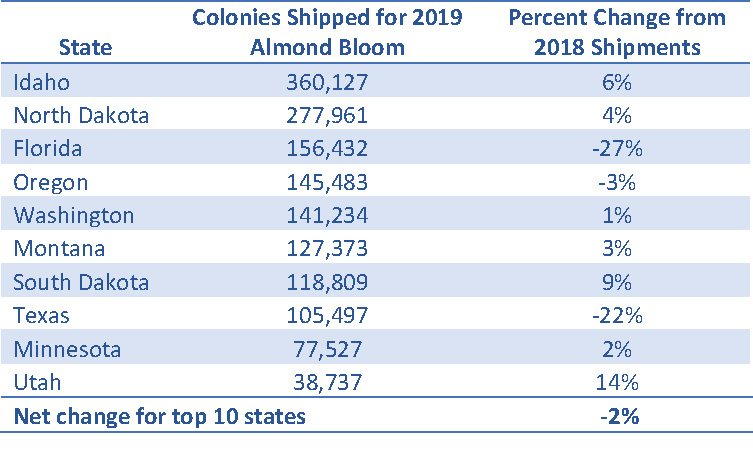
Idaho, North Dakota and Florida remained the top three states shipping colonies into California (Figure 5). As discussed by Hitaj, Smith and Hunt (2018), many honey bee colonies are transferred from the Northern Great Plains to the Pacific Northwest after honey production is finished to be stored until almonds bloom in California. So, even though Idaho looks like the top shipping state according to the CDFA border shipment data, many of those colonies in reality are coming from elsewhere. The shipment of colonies to storage in the Pacific Northwest is a trend that looks to continue into the future. Many beekeepers have seen lower mortality rates from storing colonies indoors over the winter.
Table 1 displays the numbers of honey bee colony shipments from the top 10 states shipping colonies into California for the 2019 bloom, and the percentage change from 2018 shipments. Florida and Texas saw large decreases in the number of colonies shipped for almond bloom. This was fairly surprising, given that prior to 2019 almond bloom, Florida and Texas had seen some of the largest increases in colony shipments to almonds (Goodrich, Williams, and Goodhue, 2019). According to the BIP, Texas beekeepers experienced losses of 46 percent, suggesting at least part of the decrease in colonies shipped from Texas can be attributed to high winter losses. Florida beekeepers saw losses below the national average (17.6 percent) suggesting decreases were from something other than colony losses alone. Perhaps Florida (and possibly some Texas) beekeepers who participated in 2017 and/or 2018 almond pollination may have decided the costs participating in almond pollination were not worth the returns.
Almond Pollination Fees
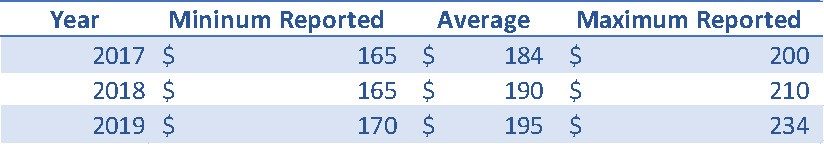
Table 2 shows minimum and maximum reported almond pollination fees, and average almond pollination fees for the California State Beekeeper’s Association (CSBA) pollination fee survey for years 2017-2019. (Note: the 2019 results should be viewed as preliminary.) According to the CSBA survey, average almond pollination fees have gone up around $5 per colony per year since 2017. The range in fees seems to have grown over time, in 2019 there is more than a $60 difference per colony between the lowest and highest fee reported. From talking with others in the industry, the average fee of $195 in 2019 may be on the lower side. Fees for a majority of colonies likely ranged from $200 to $220 per colony in 2019.
The range in fees reported is likely due to differences in colony strength requirements. In a 2015 survey of almond growers, I found a 5.7 percent premium paid for colonies contracted above the industry standard (Goodrich and Goodhue, 2016). If we assume the 2019 CSBA average corresponds to an average fee for an 8-frame colony, that means a higher than industry standard colony would have rented for on average $206 in 2019.
CSBA asks their beekeepers about projected fees for the upcoming pollination season. Many beekeepers will have already made some of their contractual arrangements in advance by the time they respond to the survey, so these projections are fairly reliable. The average projected fee per colony for the 2020 pollination season is $204. Again, if we factor in the 5.7 percent premium, that means a projected average of $216 per colony for those contracted above the industry standard of 8 frames.
Supply Issues for 2020 Almond Bloom
Given that most of the colonies in the U.S. already participate in almond pollination, it is important to think about where additional colonies will come from for the 2020 pollination season. In a research article, co-authors and I thoroughly explore this issue, in short, we expect Florida, Texas, Georgia and Louisiana to supply a large amount of increased almond pollination going forward (Goodrich, Williams and Goodhue, 2019). Clearly, as seen in Table 1, Florida and Texas saw decreases in their supplies of colonies between 2018 and 2019. This suggests fees may have to increase even further to get sustained participation from beekeepers in these areas.
One issue that I foresee as a potential problem this year is the drought that has been occurring in parts of the south this fall. From September through the week of November 5, 2019, Georgia and Texas have been experiencing at least a moderate drought over 58 percent and 48 percent of each state, respectively (National Drought Mitigation Center, 2019). Florida and Louisiana have seen smaller, but still significant averages of 18 percent and 13 percent of the total area in each state experiencing at least moderate drought. These are states that beekeepers often place colonies in after honey flow in the Northern Great Plains (Hitaj, Smith and Hunt, 2018). The southern climate usually facilitates at least some pollen and nectar flow during the fall months. This year, southern beekeepers likely had to provide more food supplements than usual. This has the potential to impact the overall health of colonies coming out of these southern states.
Another factor that may have an indirect impact on the market for almond pollination services this year and in the years to come is the decreasing trend in honey prices. Commercial beekeeping operations operate on fairly small margins, so even small decreases in the honey price may have a substantial impact on the economic sustainability of these operations. Smaller honey profits (or in some cases losses) places more importance on almond pollination income for beekeepers to stay in business. Almond growers may want to check in with their beekeepers to make sure they have adequate cash flow to make the trek to California this year. Paying a percentage of the total pollination expense up front may ease some of the beekeeper’s cash flow issues, while providing additional benefits to the almond grower. The almond grower may ask for a discounted pollination fee for making the down-payment, in addition to having added security that the beekeeper will make it to their almond orchards with the contracted colonies.
Hive Density, Colony Strength and Crop Insurance Requirements
I wanted to touch on the relationship between colony strength, hive density and crop insurance requirements because I personally have heard a lot of conflicting information regarding crop insurance requirements. Beginning in 2013, USDA Risk Management Agency (RMA) and the Federal Crop Insurance Corporation (FCIC) began allowing for substitution between colony strength and hives per acre in their almond crop insurance policy. The current policy document states as a guideline a producer should have at minimum two colonies with six active frames, or its equivalent (USDA RMA and FCIC, 2018). Technically, that means one 12-frame colony per acre or 1.5 8-frame colonies per acre would satisfy this requirement. Almond growers can even deviate from this standard as long as they have consistently been using the same number of hives per acre and colony strength requirements and have had consecutive non-loss years. (This flexibility in the policy allows growers to capitalize on benefits from self-fertile varieties that require fewer colonies per acre.)
Many almond growers are looking for ways to cut pollination costs given they have increased so much over the last decade. Typically, growers look at the per-colony fee as what needs to be lowered. In my opinion, this is not a good place to cut costs given the uncertainty in the supply of honey bee colonies. By trying to get the lowest fee possible, growers often end up with an unreliable beekeeper or colonies with very low strength. There are some ways to get lower fees, as I discussed previously negotiating with your beekeeper to pay a portion up front for a lower fee is one option. Providing bee holding yards for before bloom, locked gates in orchards, or some other benefit to the beekeeper/pollination broker may also get you a lower fee, though I would not count on substantial cuts.
In my opinion, a much better place to cut costs is by slightly adjusting colonies per acre. For example, if you have a 300 acre almond orchard which you typically stock with 2 colonies per acre, adjusting that down slightly to 1.8 colonies per acre can save you around $12,000 on your pollination expenses (assuming a $200 fee-per colony). If you are contracting for 8-frame colonies (as many growers are) that puts you at over 14 frames per acre, still above the 12-frame requirement for crop insurance. Now, here is my cautionary statement: I am an economist and am NOT a crop insurance agent, adjuster or almond farm advisor. So before substantially changing your hives per acre and/or colony strength requirements you should check with your farm advisors and crop insurance agent to make sure it won’t cause any problems with yields or crop insurance payments. Unfortunately, there is not a “one size fits all” solution and a lot of these adjustments will have to be orchard specific.
Conclusions
I believe the memory of last year’s cold and wet almond bloom period will be weighing heavily on grower’s minds going into this season, as will lower per-acre yields in 2019. To me this means almond growers will want many strong colonies so waiting until the last minute to contract is probably not a good strategy this year. Beekeeper profitability has become a struggle due to increased costs from colony health issues and low honey prices. Communicating with your beekeeper and paying them a fair price for their colonies will likely ensure a secure supply of pollination services in years to come.
Best of luck in your almond pollination agreements, and wishing you a happy, healthy and prosperous 2020!
References:
Champetier, A., H. Lee, and D.A. Sumner. 2019. “Are the Almond and Beekeeping Industries Gaining Independence?” Choices. Quarter 4. Available online: http://www.choicesmagazine.org/choices-magazine/theme-articles/pollination-service-markets-evolution-and-outlook/are-the-almond-and-beekeeping-industries-gaining-independence
Goodrich, B.K., J.C. Williams, and R.E. Goodhue. 2019. “The Great Bee Migration: Supply Analysis of Honey Bee Colony Shipments into California for Almond Pollination Services.” American Journal of Agricultural Economics 101: 1353–1372.
Goodrich, B., and R.E. Goodhue. 2016. “Honey Bee Colony Strength in the California Almond Pollination Market.” ARE Update 19: 5–8.
Hitaj, Claudia, David J. Smith, and Kevin A. Hunt. “Pollination services: Honeybee movements across the US and the impact of travel on honeybee health.” 2018 Annual Meeting, August 5-7, Washington, DC. No. 273783. Agricultural and Applied Economics Association, 2018.
USDA NASS and CDFA. 2019. “2019 California Almond Objective Measurement Report.” Available online:
http://www.nass.usda.gov/Statistics_by_State/California/Publications/Specialty_and_Other_Releases/Almond/Objective-Measurement/201907almom.pdf
USDA RMA and FCIC. 2018. “Almond Loss Adjustment Standards Handbook 2019 and Succeeding Crop Years.” FCIC25020 (10-2018). Available online:
http://www.rma.usda.gov/-/media/RMAweb/Handbooks/Loss-Adjustment-Standards—25000/Almonds/2019-25020-Almond-Loss-Adjustment.ashx
The National Drought Mitigation Center. 2019. United States Drought Monitor. Percent Area in U.S. Drought Monitor Categories. Available online:
http://droughtmonitor.unl.edu/Data/DataTables.aspx


