With every new year comes the realization that almond orchards will be in full bloom before long. This article summarizes some considerations for the 2024 almond pollination season, including a discussion on how to cut pollination expenses this year while maintaining in compliance with requirements for federal crop insurance.
Almond Industry Update
Many almond growers are feeling the stress of narrowing profit margins over the last couple of years. For context, the USDA National Agricultural Statistics Service (NASS) 2018-22 average almond price was $1.98 per pound, far lower than the previous five-year average (2013-17) of $3.05 per pound. While almond prices have remained relatively low the last few years, input prices have increased substantially. Additionally, this year excessive pest damage rates have caused many growers to receive substantial quality-related price deductions. The current state of almond profit margins has led to increasing rates of orchard removal and abandonment over the last few years.
The Almond Board of California and Land IQ estimate the removal of around 82,958 acres of almonds by September 2023, approximately 6% of the 1.4 million bearing acres in 2023. This is up slightly from 2022, when an estimated 60,421 acres where removed. They also estimate nearly 8,000 acres have been abandoned and not yet removed, and another 11,523 acres have potentially been abandoned.
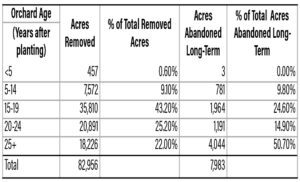
To get a better idea of what is driving these removals and abandonments, I dug a bit further into the Land IQ removals report. Typically, almond orchards are thought to last 25 to 30 years after planting. Older orchards are the most likely candidates for removal or abandonment; however, many have speculated the additional removal or abandonment of younger orchards in the past couple of years due to water scarcity concerns and low profit margins. Table 1 shows the number of 2023 removals and long-term abandonments by the orchard age. It shows a large portion of removals (78%) were orchards less than 25 years of age, and 43% of removals occurred in orchards less than 20 years old. Roughly half of long-term abandonments occurred in orchards less than 25 years of age, and the other half occurred in older orchards.
Figure 1 shows for each county the proportion of total acres removed or abandoned in 2023 that were acres planted less than 20 years ago. It is clear the southern San Joaquin Valley has seen a relatively higher proportion of young orchards removed out of total removals. This is not surprising given the southern San Joaquin Valley is generally more water stressed than the northern San Joaquin and Sacramento Valleys.
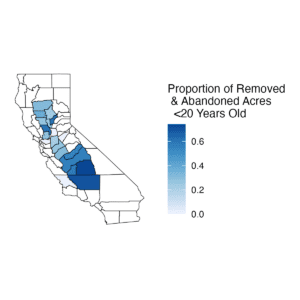
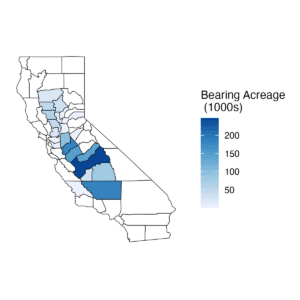
Table 1 and Figure 1 indicate water availability coupled with narrowing profit margins may be driving growers in some areas to remove or abandon orchards earlier than in the past. Despite these removals, at least 1.3 million bearing acres of almonds remain going in to 2024. Figure 2 displays bearing almond acreage by county for 2023. The counties of Kern, Kings and Tulare, which saw relatively low proportions of young acres being removed or abandoned in Figure 1, still contain significant amounts of almond acreage (about 22% of the state’s total).
Estimated Colony Demand
Figure 3 plots the estimated demand for colonies based on bearing almond acreage each year from 2017 to 2024 as well as the total number of colonies in the U.S. on January 1. Estimated demand is calculated using two colonies per acre for traditional varieties and one colony per acre for self-fertile varieties (Shasta and Independence). For the 2023 almond bloom, roughly 1.4 million almond acres (6.6% in self-fertile varieties) required an estimated 2.6 million honeybee colonies for pollination (Figure 3).
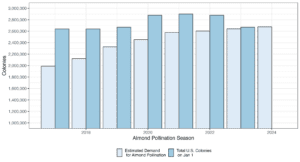
Note: Estimated demand is two colonies per acre for traditional varieties and one colony per acre for self-fertile.
As seen in Figure 3, the estimated demand for colonies in 2024 is 2.7 million colonies, roughly 1.3% higher than the 2.6 million required in 2023. However, given the higher rates of removals of almond acreage in recent years and the timing of USDA reporting, this 2.7-million number could be a slight overestimate. In recent years, it has seemed self-fertile variety plantings as well as orchard removals have started leveling off the estimated demand for colonies. However, the colonies that will be required for almond pollination in 2024 represents virtually 100% of the 2.7 million colonies in the U.S. on Jan. 1, 2023, so at least in the short run, it’s unlikely this leveling-off of demand will put downward pressure on pollination fees.
Colony Supply Issues
The primary influence on the supply of available colonies for almond pollination is colony health and populations throughout the United States. Colony health issues can impact both the strength of colonies and the total number of colonies that survive the winter. The Bee Informed Partnership reported the 2022-2023 winter mortality rates for commercial beekeepers was 37.6%, the second highest colony loss rate since they have been conducting their survey. This loss rate is noticeable in Figure 3, see page 6, where for 2023 almond pollination the demand for colonies was almost equivalent to the supply on Jan. 1, 2023.
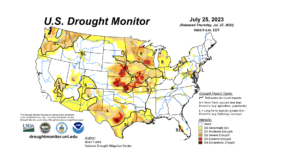
Weather during the summer months can have an impact on honey production as well as bee health due to the availability of nutritious forage. Figure 4 shows the U.S. drought monitor as of July 25, 2023 displaying drought conditions across large swaths of the U.S. Texas and Minnesota are major honey-producing states with some of the worst drought conditions. As of July 1, 2022, 194,000 colonies were in Texas and 105,000 colonies were in Minnesota, totaling roughly 10% of the total U.S. population at that time. Beekeepers with colonies in the areas plagued by drought may suffer higher winter mortality rates and lower colony strength of surviving colonies in addition to higher costs of feeding.
Almond Pollination Fees
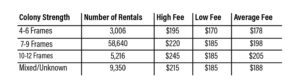
Table 2 shows the distribution of fees reported by colony strength requirement from the California State Beekeeper’s 2023 Pollination Fee Survey. The average fee for the 2023 almond pollination season for the most common colony strength requirement (seven to nine frames) was $198 per colony, though this ranged from $185 to $220 per colony. Smaller colony strength requirements of four to six frames received an average of $178 per colony, while higher colony strength requirements of 10 to 12 frames averaged $205 per colony. The overall projected average fee for 2024 is $209 per colony, higher than the $196 per colony overall weighted average for 2023, suggesting beekeepers expect fees to increase slightly going in to 2024.
Hive Density, Colony Strength and Crop Insurance Requirements
In 2024, growers may be looking to cut expenses this year due to low almond prices. Most almond acreage is insured through USDA Risk Management Agency (RMA) and the Federal Crop Insurance Corporation (FCIC). To collect indemnities when a disaster occurs, growers must make sure they are adhering to the requirements of crop insurance. Failure to use an adequate number of bee colonies and/or frames per colony is not an insurable cause of loss and will often be the first practice verified when a grower makes a claim. Thus, I touch on how to go about cutting pollination costs in the right way so that crop insurance requirements are met.
USDA and FCIC allow for substitution between colony strength and hives per acre in their almond crop insurance policy. The current policy document (Almond Loss Adjustment Standards Handbook 2019 and Succeeding Crop Years) states as a guideline that a producer should have at minimum two colonies with six active frames, or its equivalent. Technically, that means one 12-frame colony per acre or 1.5 eight-frame colonies per acre would satisfy this requirement. Almond growers can even deviate from this standard as long as they have consistently been using the same number of hives per acre and colony strength requirements and have had consecutive non-loss years (this flexibility in the policy allows growers to capitalize on benefits from self-fertile varieties that require fewer colonies per acre.)
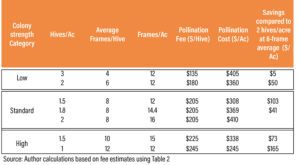
I expect a large portion of growers in the past have been using the standard two hives per acre at an eight-frame average. Table 3 displays a few combinations of hive density and colony strength that satisfy two conditions: 1.) They meet the minimum standard defined by crop insurance (12 frames per acre), and 2.) they result in cost savings compared to renting two hives per acre at an eight-frame average. The pollination fees per hive are my estimates based on those reported in Table 2.
Table 3 shows there is flexibility when it comes to pollination expenses. Even using the lowest colony strength category (4 frames) at 3 hives per acre can lead to cost savings at the right pollination fee per hive. The key to accessing this flexibility will be working directly with your pollination provider. If your beekeeper has already spent a substantial amount of time and inputs to provide high-strength colonies, it may not be profitable for them to make an agreement with low colony strength and corresponding low fees, in which case reducing the hives per acre for a higher-colony strength category may be the mutually beneficial solution.
Other Pollination Contract Elements
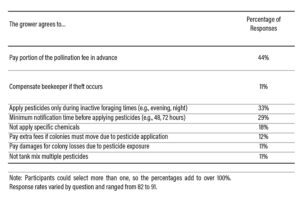
There are other ways growers can work with their pollination provider to lower pollination expenses in return for lowering risk in some way or simply providing convenience. Growers can offer bee holding yards before bloom, reduce risk of colony theft by providing locked gates or other security measures in orchards, or improve the health of bees through planting bee-friendly cover crops or taking extra precautions to prevent pesticide exposure. For example, Table 4 shows the percentage of respondents indicating they have beneficial clauses in their almond pollination agreements from a 2021 survey of commercial beekeepers.
Almond pollination services continues to require most of the total colonies in the U.S. Even when times are tight, make sure to communicate with your beekeeper and pollination broker, and maintain good relationships to ensure a secure supply of pollinators going forward.
I have written a number of these pollination outlook articles over the years and have archived them and other resources on the following website: almondpollination.ucdavis.edu/